1. We launch a Project
A non-profit reaches out to us with a data visualization request. We then follow up to gather the necessary materials, such as datasets and project goals, before notifying volunteers about the new project launch.
Once everything is ready, the project goes live on this page. All volunteers are then invited to the project kick-off event.
Project page: https://www.vizforsocialgood.com/join-a-project
2. You visualize the Data
Volunteers begin visualizing the data, either independently or in collaboration with other volunteers. (If you're looking for a partner, feel free to ask in our Slack community.)
You will submit your work via a Google Form and showcase it on social media.
3. We create Impact at Scale
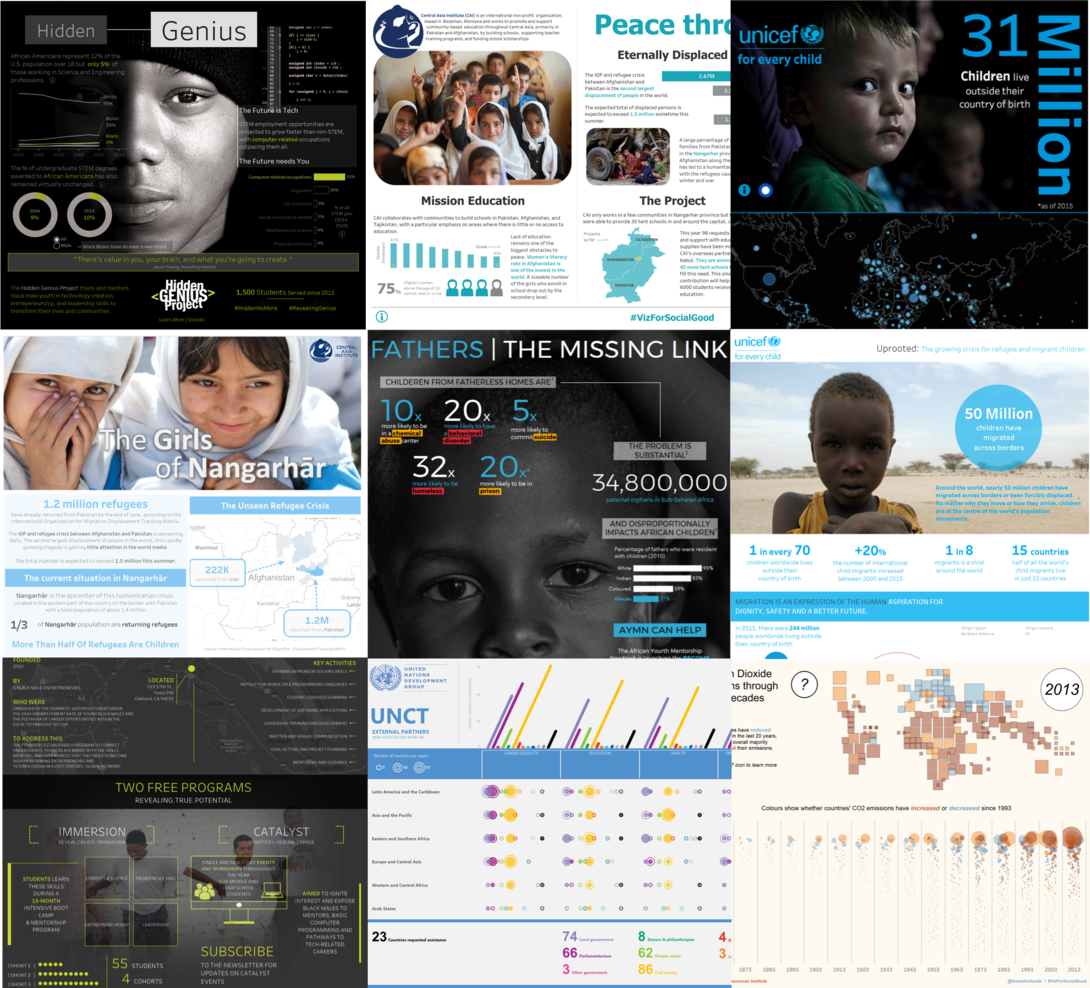
The non-profit typically receives 30-40 visualizations from our volunteers.
They will then select their top 3-5 visualizations based on their own criteria.
The selected volunteers will be invited to present their work at the end-of-project live event.


