
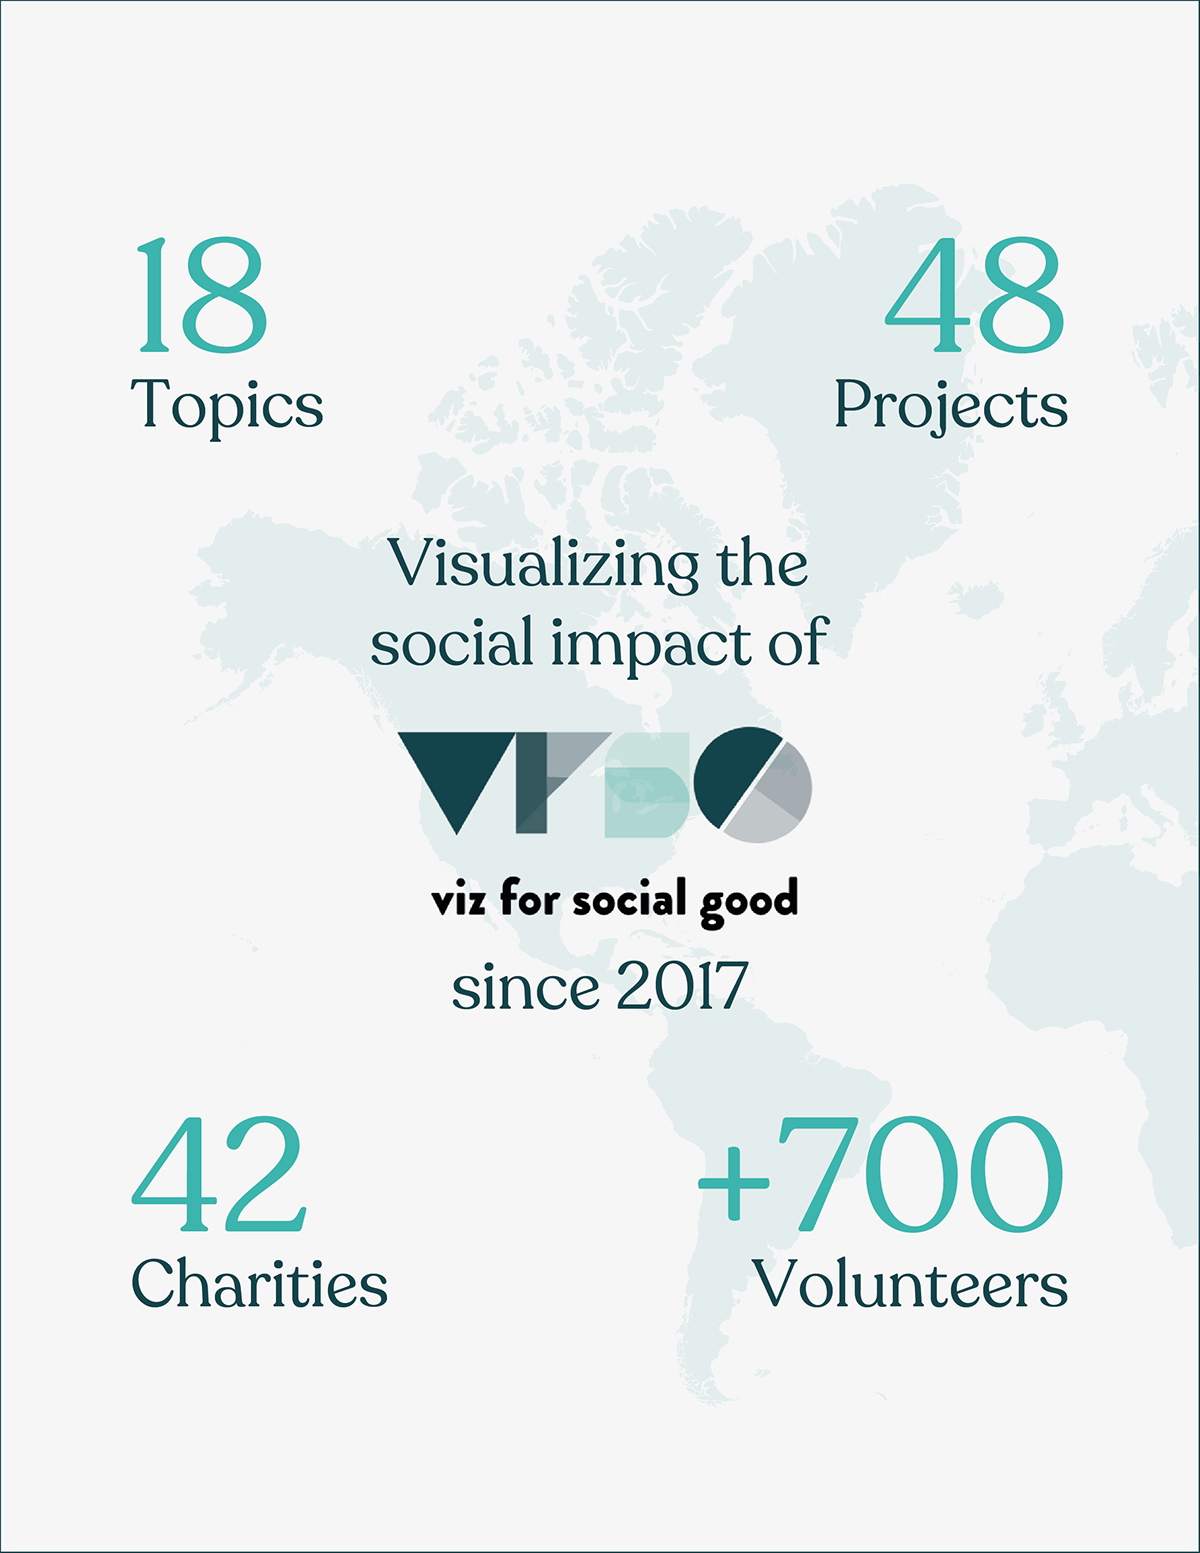
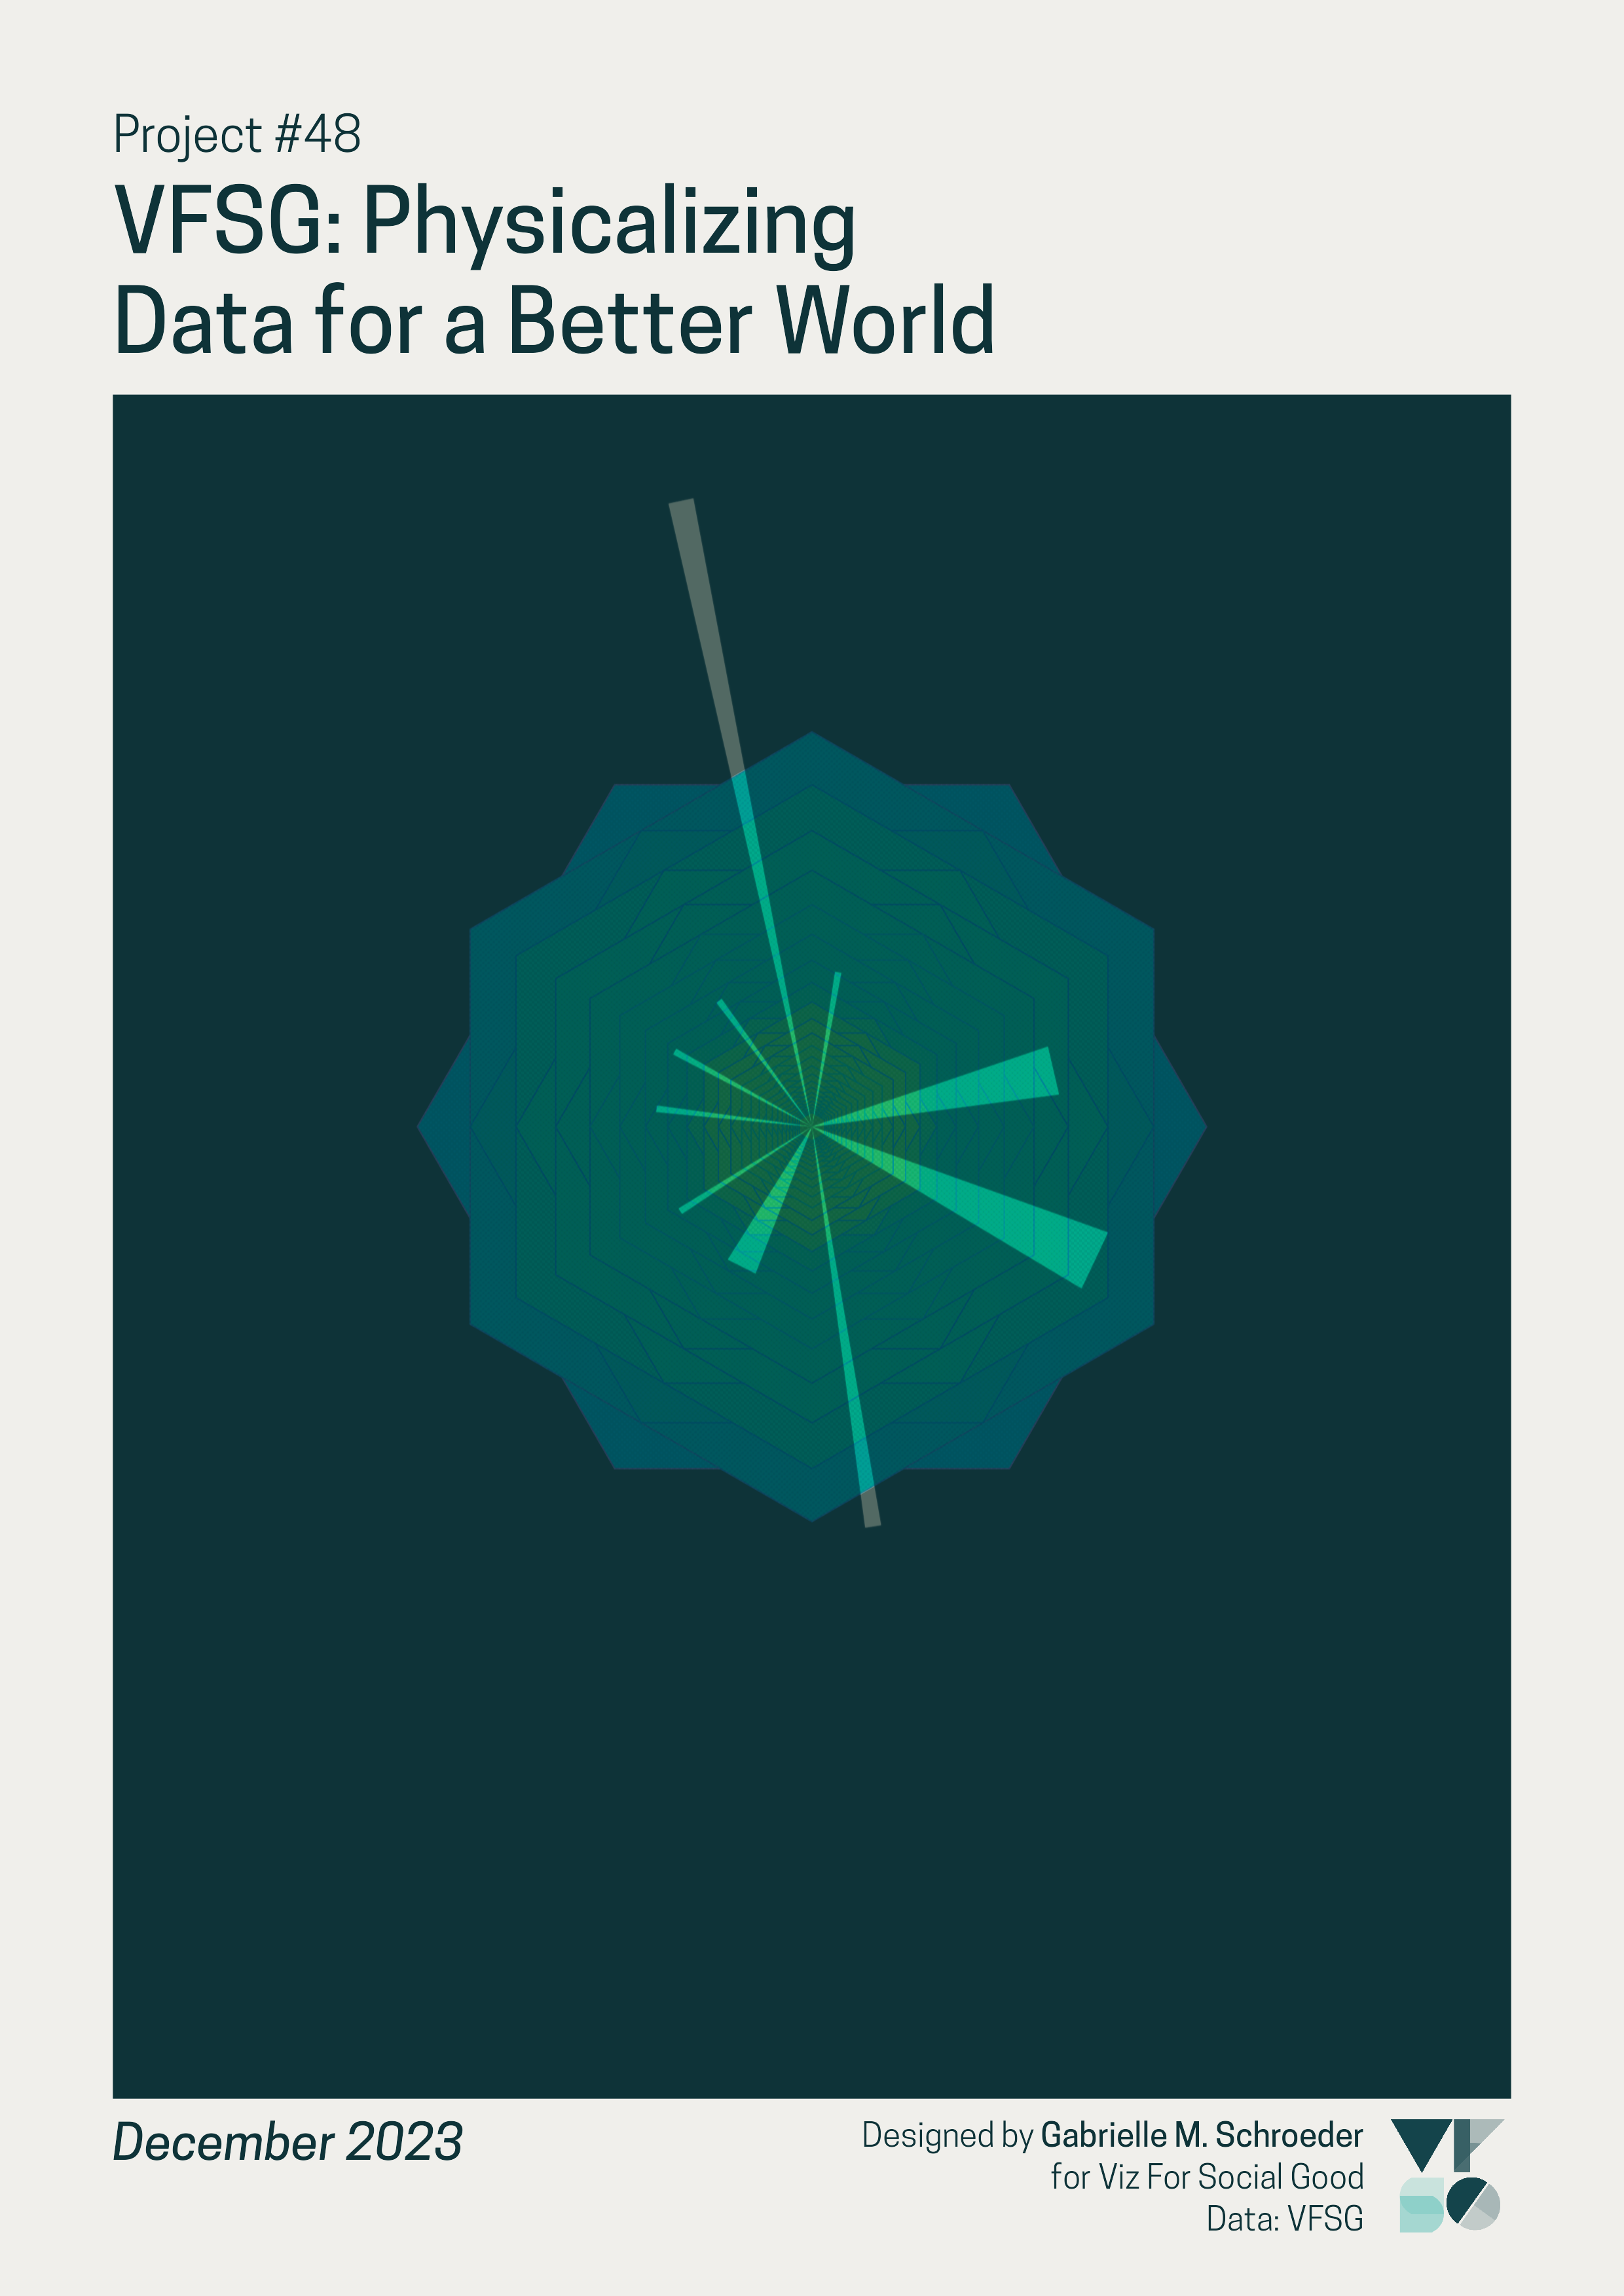
Visualizing the Social Impact of Viz for Social Good
Welcome to our Impact journey!
Join us on a visual journey that showcases the incredible strides we've made together. Picture a world where each dot on a map represents a beacon of change – that's the story we're eager to share. We're not just sharing numbers, we’re telling the stories of real lives touched and communities transformed.

Project Brief
Let's illuminate the power of data visualization in driving social change. Your creativity and expertise can help us tell the story of Viz for Social Good's impact and inspire further action for the betterment of communities worldwide.
Viz for Social Good is a non-profit that leverages the power of data visualization to support non-profit organizations and promote social causes. By collaborating with various charities, Viz for Social Good has facilitated numerous projects aimed at addressing critical issues around the globe. This project seeks to showcase the collective impact of these initiatives, demonstrating the significant contributions made to various causes and the benefits realized by communities and stakeholders.
The aim of this project is to create a series of data visualizations that highlight the cumulative social impact of Viz for Social Good's collaborations with charity partners. These visualizations will serve to illustrate the breadth and depth of change effected through these projects, encompassing a range of causes and outcomes.
Stories of change & Power of participation
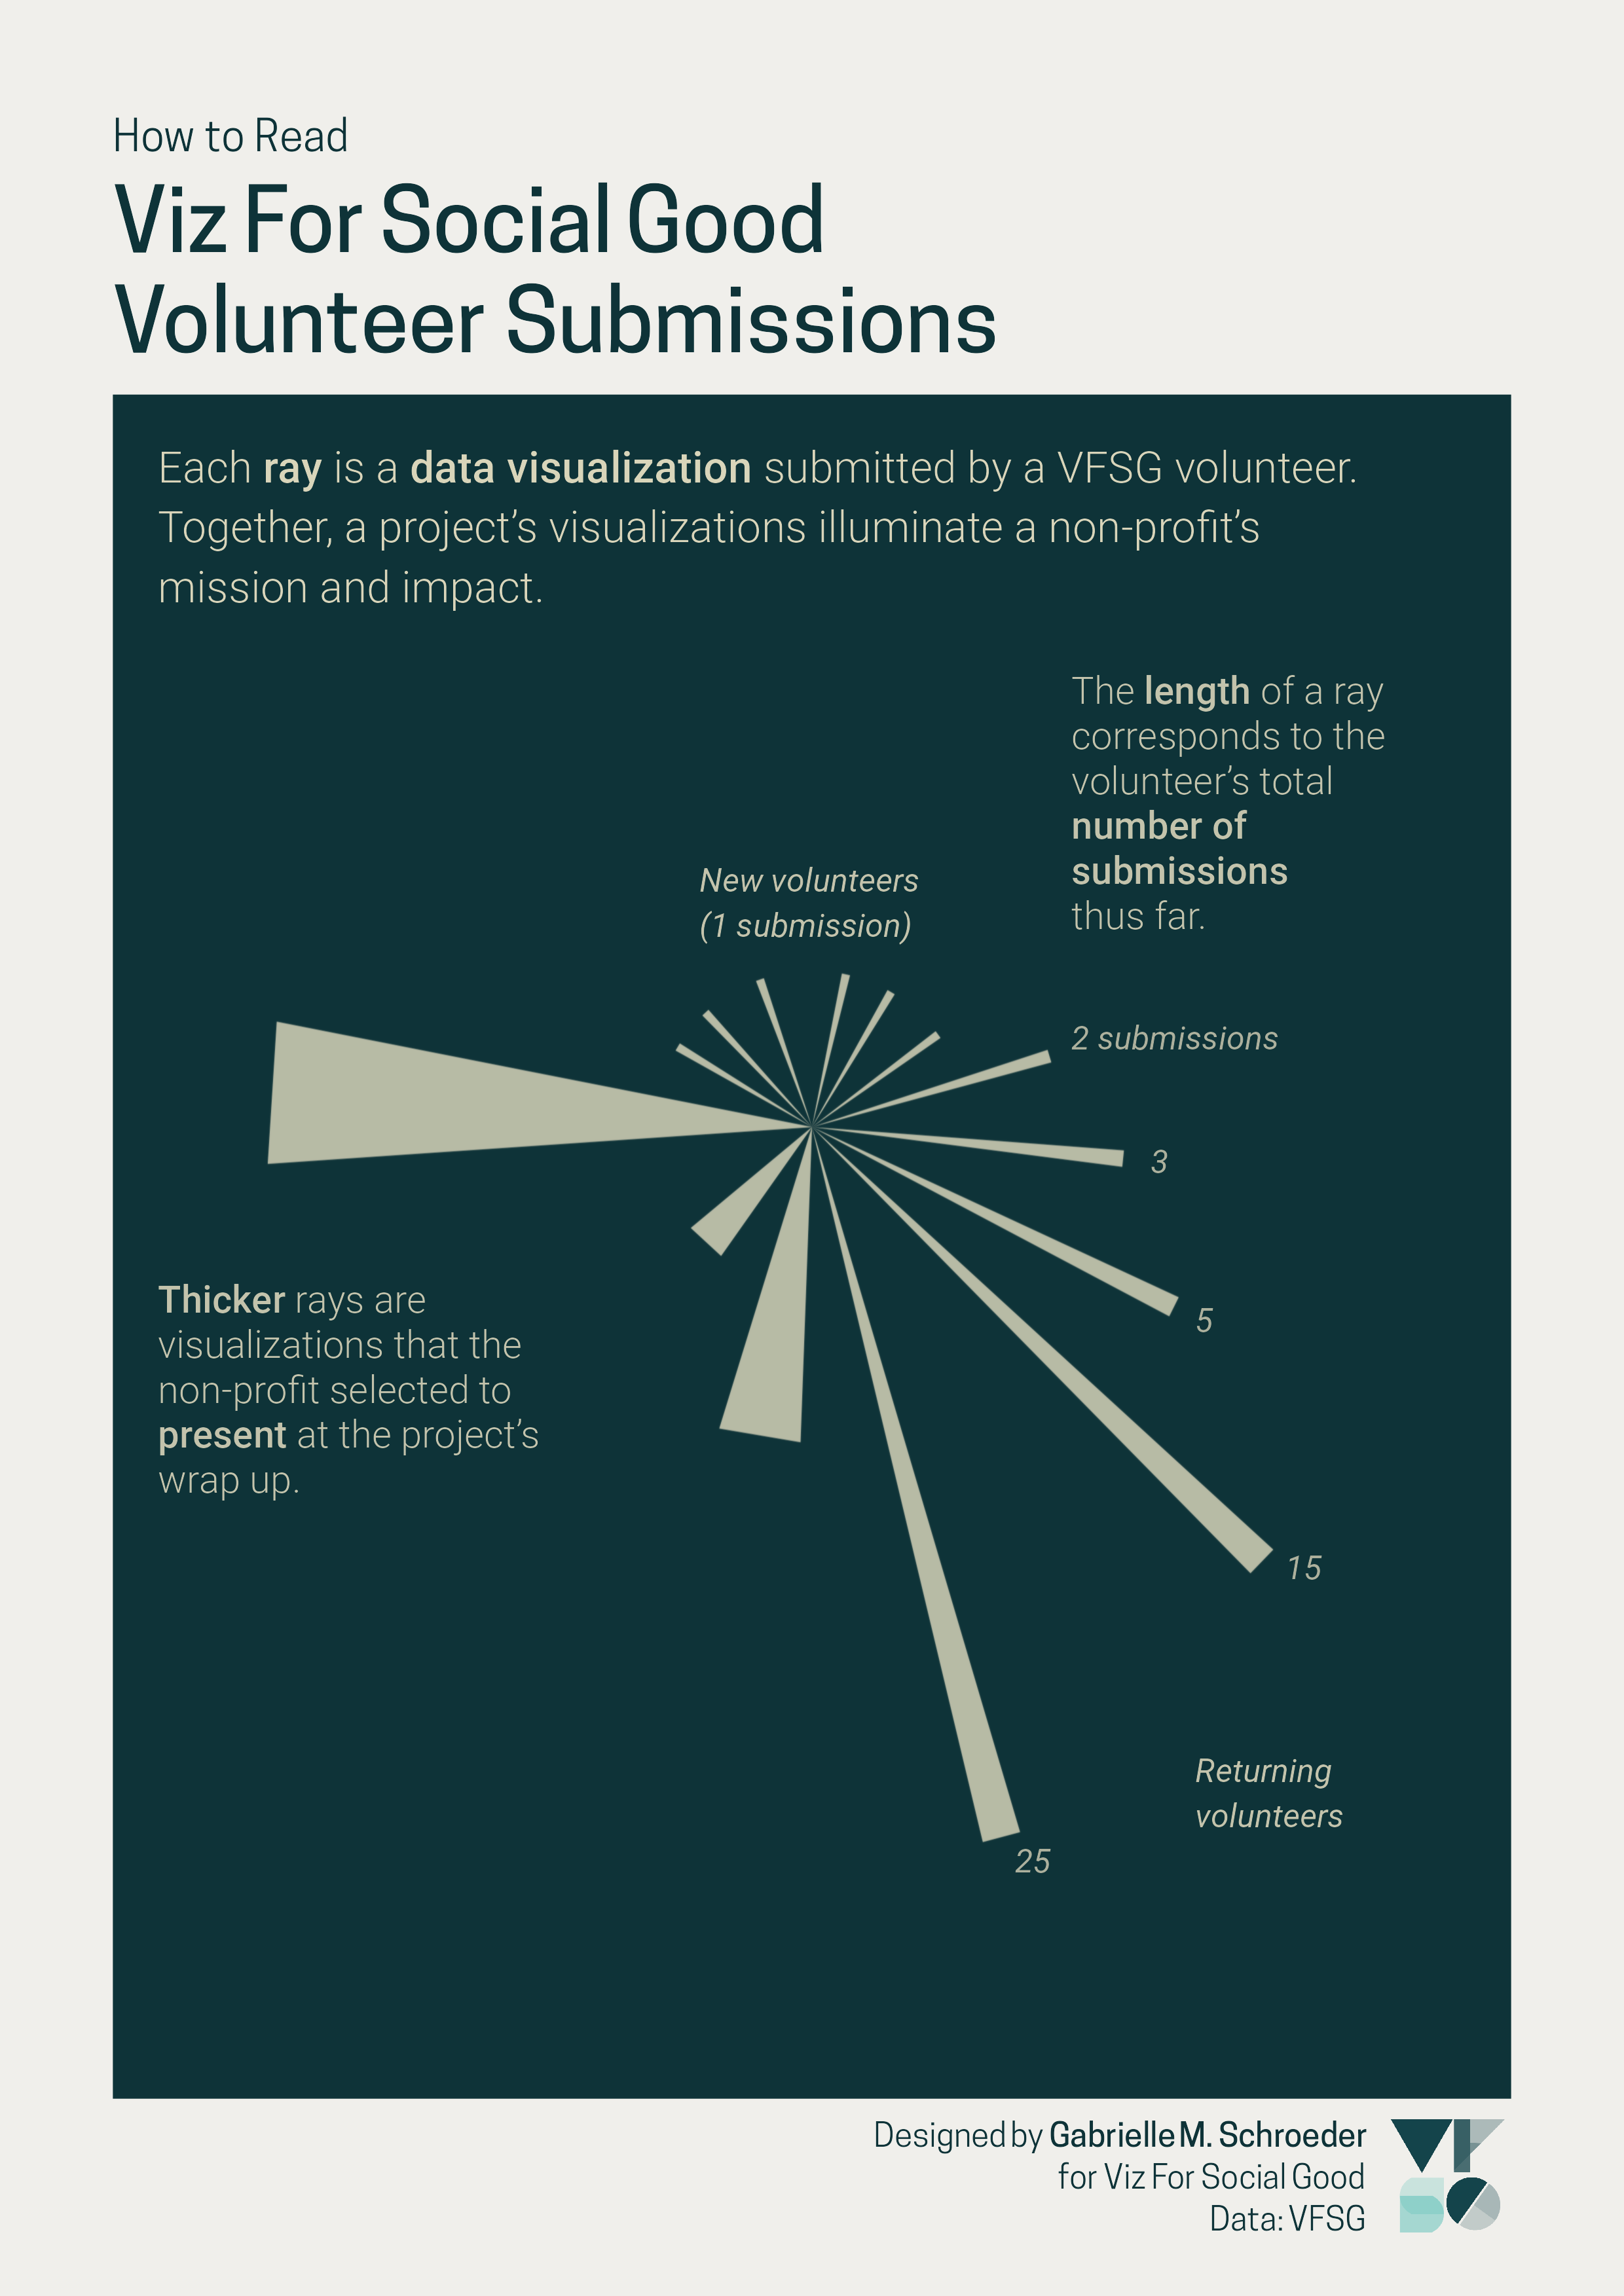
Take us through the data stories of specific projects that have left a lasting mark. Show us the mosaic of volunteer efforts, where every piece is a contribution to the success of our mission. We need your help to demonstrate the tangible benefits and changes brought about by these projects, such as improvements in health outcomes and educational access.
Call to Action
We need your help to demonstrate the tangible benefits and changes brought about by the projects, such as improvements in health outcomes, educational access, environmental sustainability, and economic opportunities.
Emphasize the collaborative nature of the work, showcasing how partnerships between Viz for Social Good, its volunteers, and charity partners have driven positive change.
Encourage continued support and engagement from the community, potential volunteers, and partners by illustrating the value and impact of these projects.
Motivate the audience to support future projects by volunteering, partnering, donating or spreading the word about Viz for Social Good's mission and achievements.
Audience
The primary audience includes potential volunteers, current and prospective charity partners, funders, and the broader community interested in social good and data visualization.
Let's illuminate the power of data visualization in driving social change. Your creativity and expertise can help us tell the story of Viz for Social Good's impact and inspire further action for the betterment of communities worldwide.
Use of Data Visualization
Visualizations and stories shared will be showcased on our social media platforms, website, external and internal presentations, conferences and other publications.
Key Dates
Project Starts: 15 March 2024
Live Presentations: 19 April 2024 | Recording
Guest Judge: Adam Mico
Adam Mico is the Principal, Data Visualization Enablement and Fluency at Moderna. He is a published author, a Data Leadership Collaborative advisory board member, a Dreamforce Golden Hoodie recipient, a 3x Tableau Visionary & 2x Michael W. Cristiani Community Leadership Award Winner (Tableau Conference).
Top 5 volunteers selected
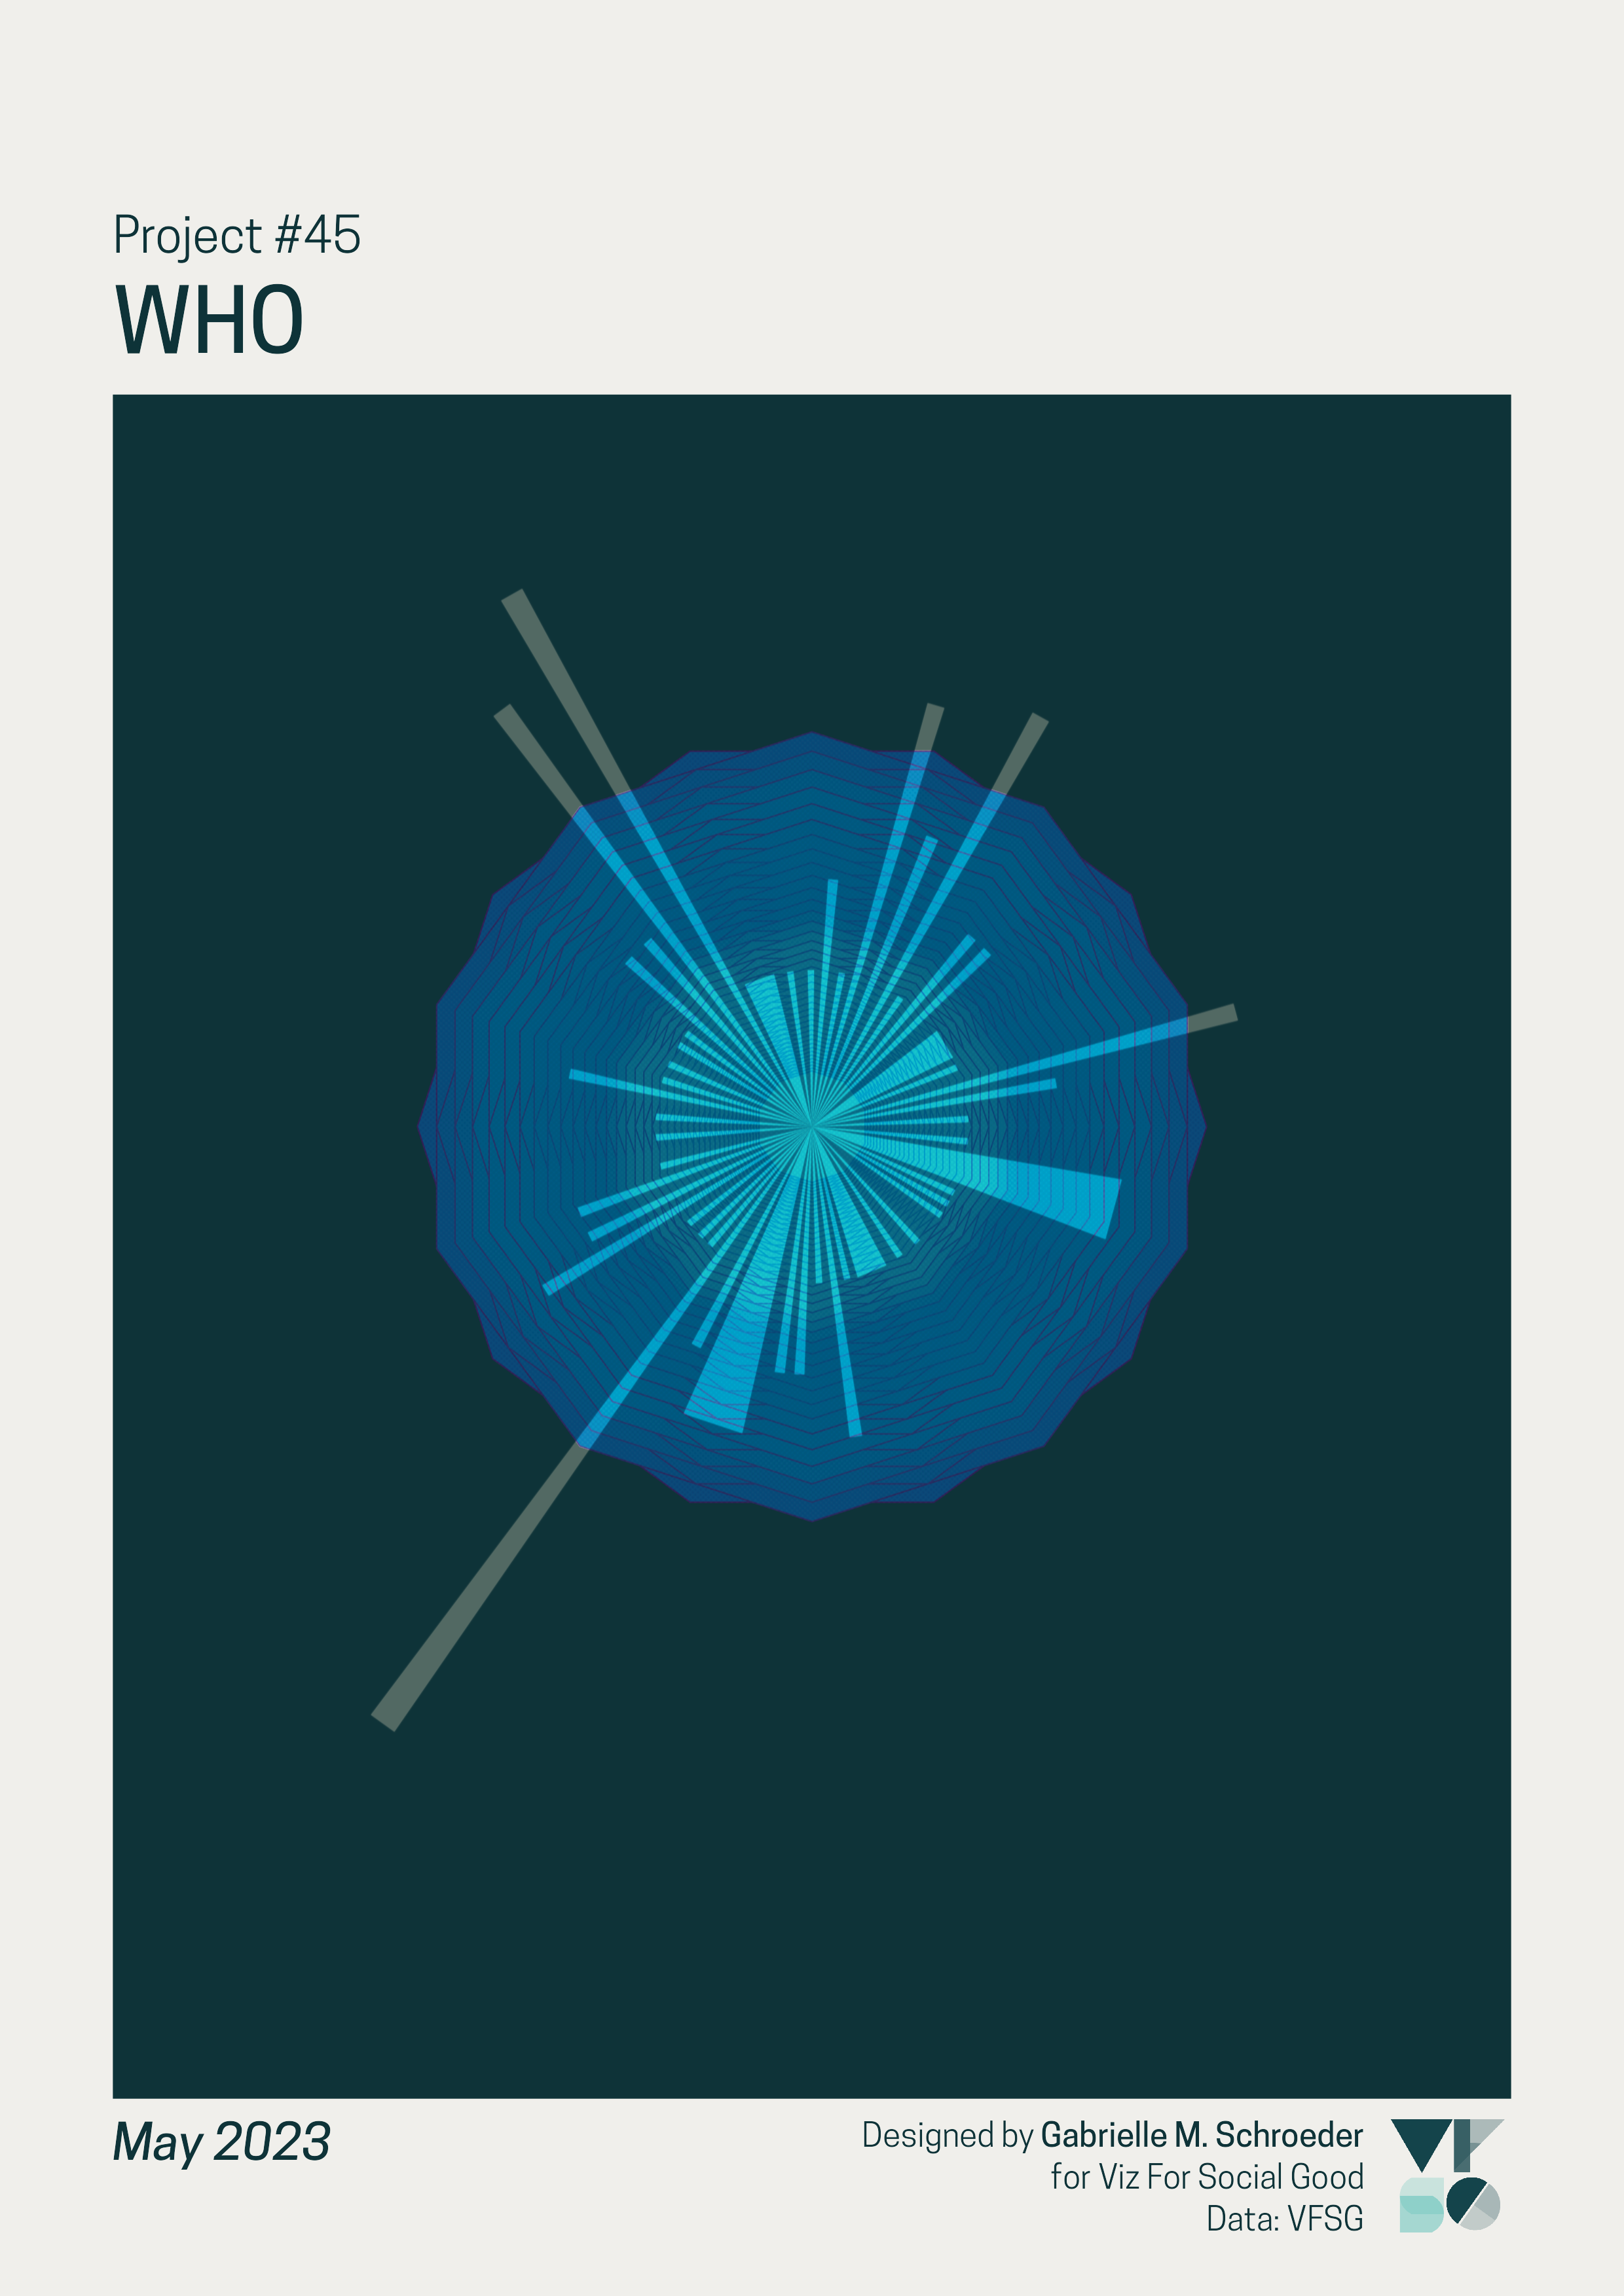
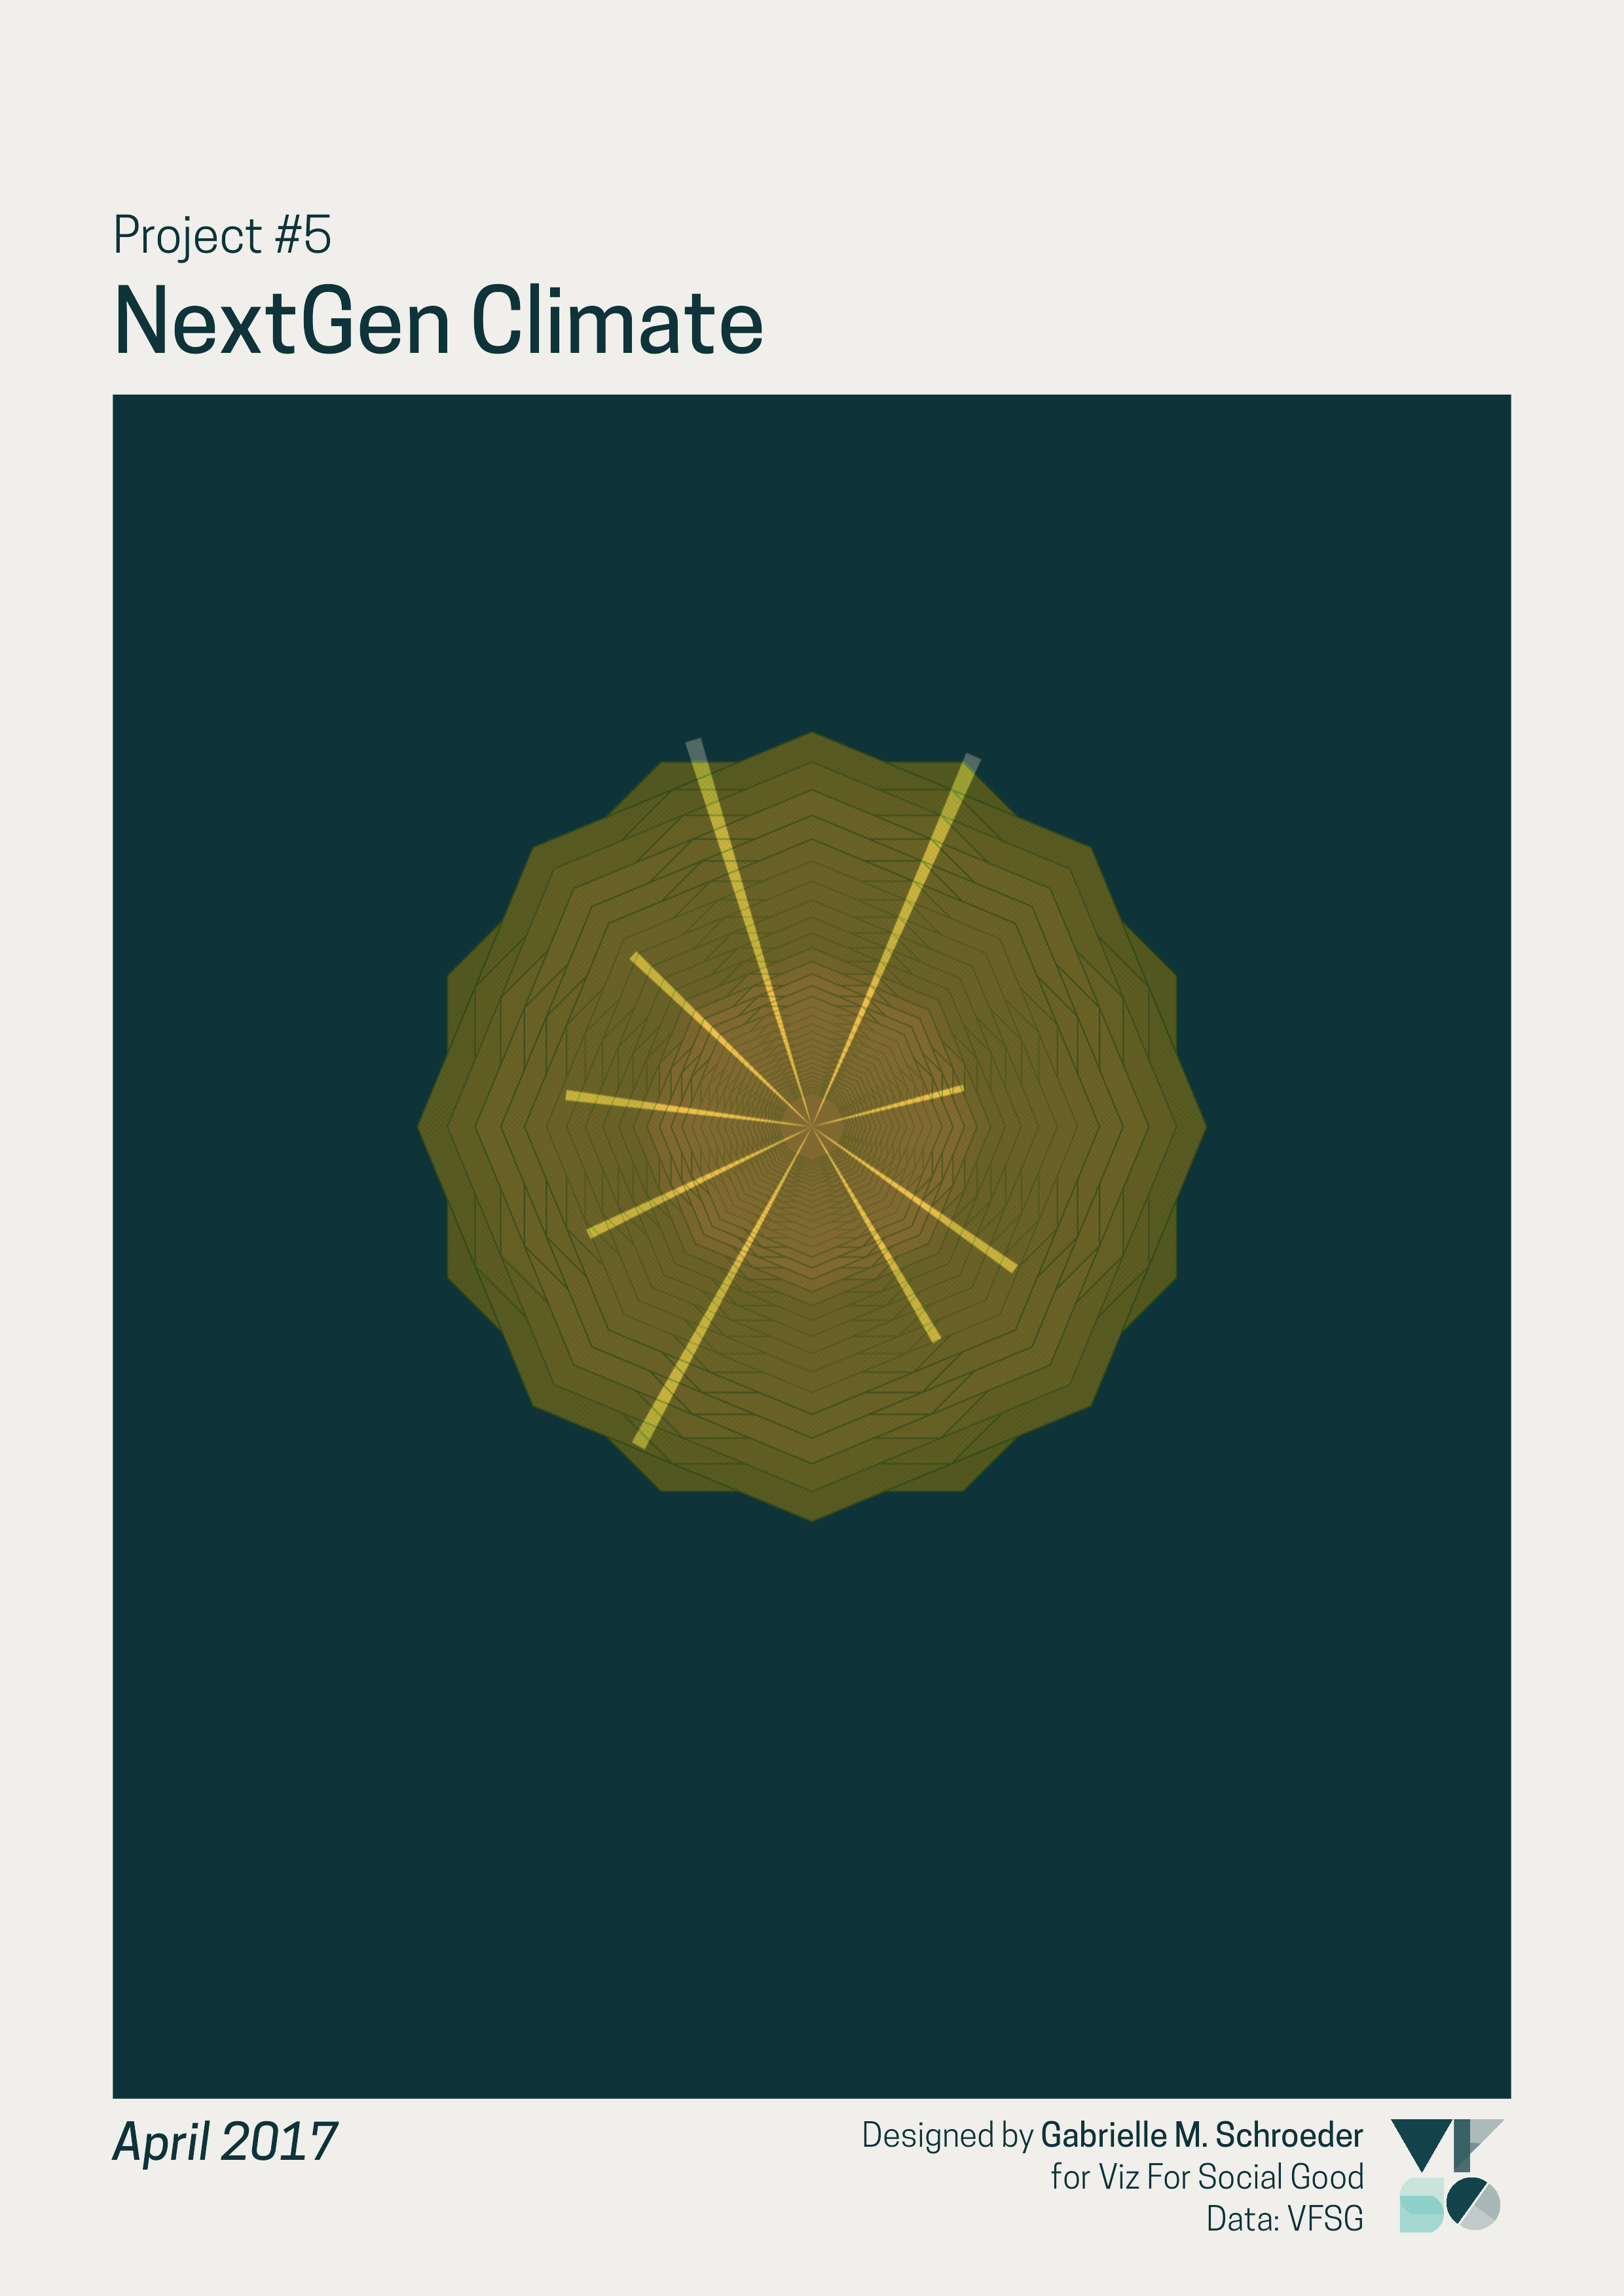
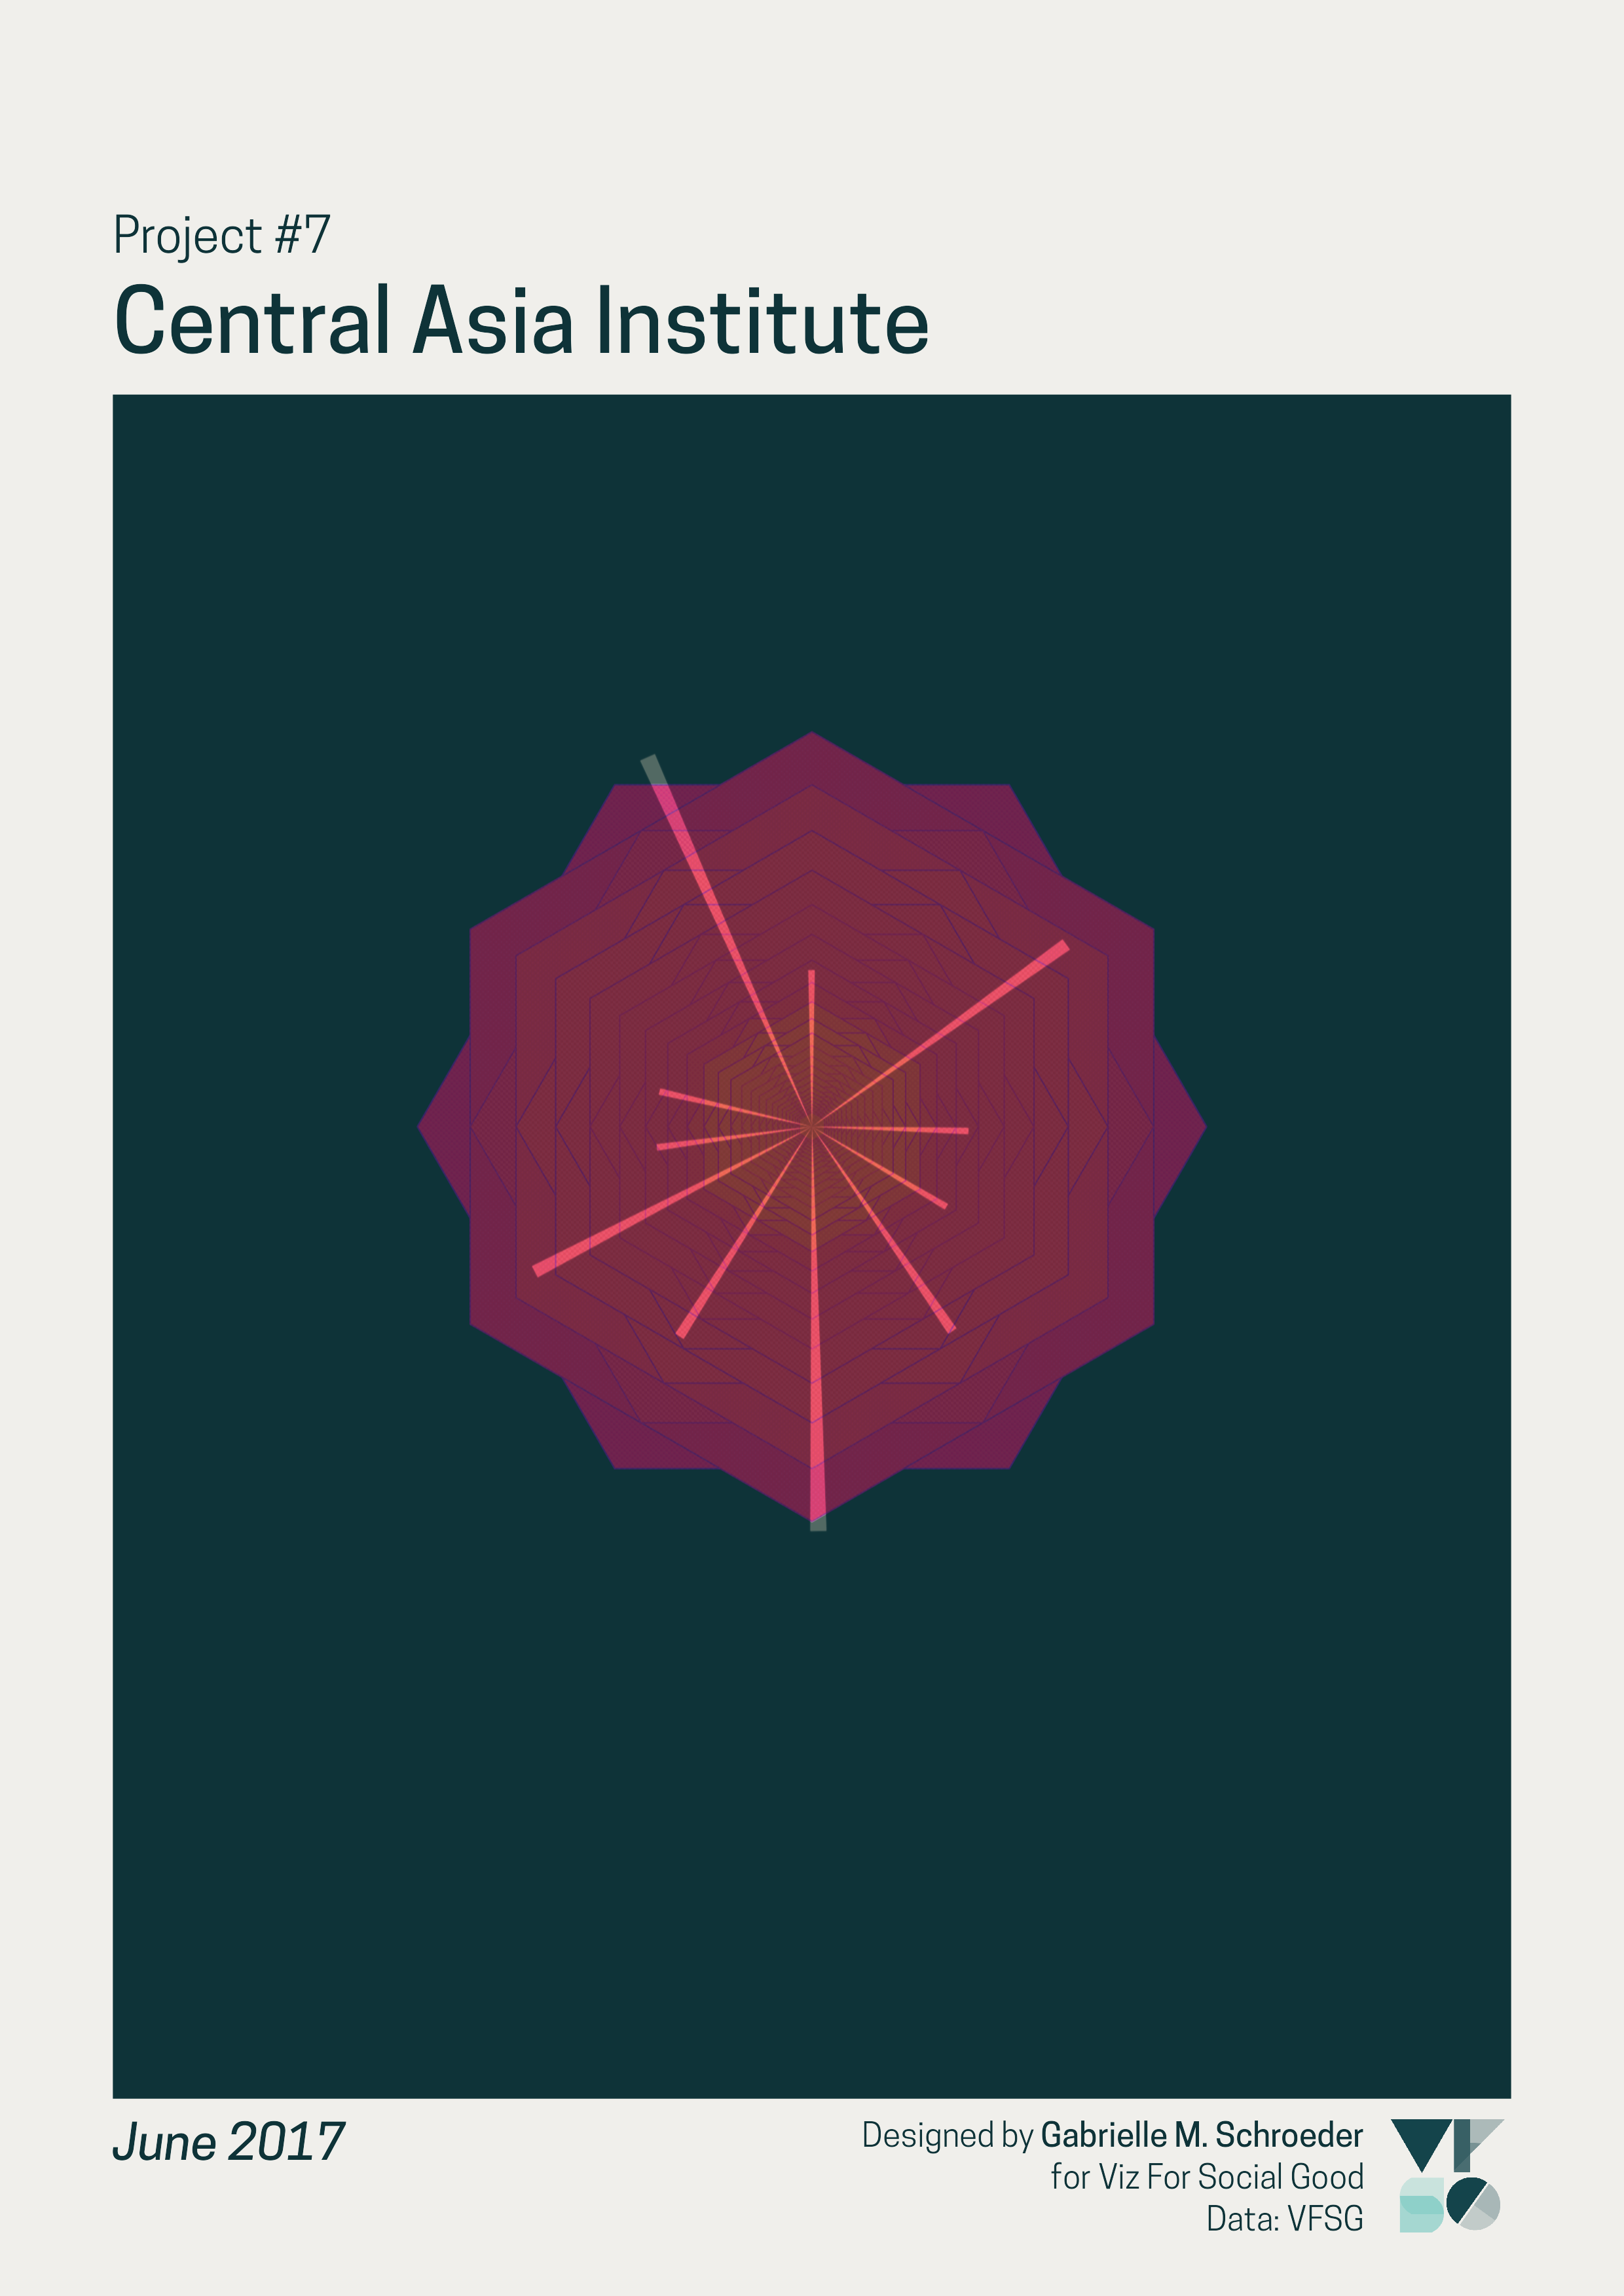
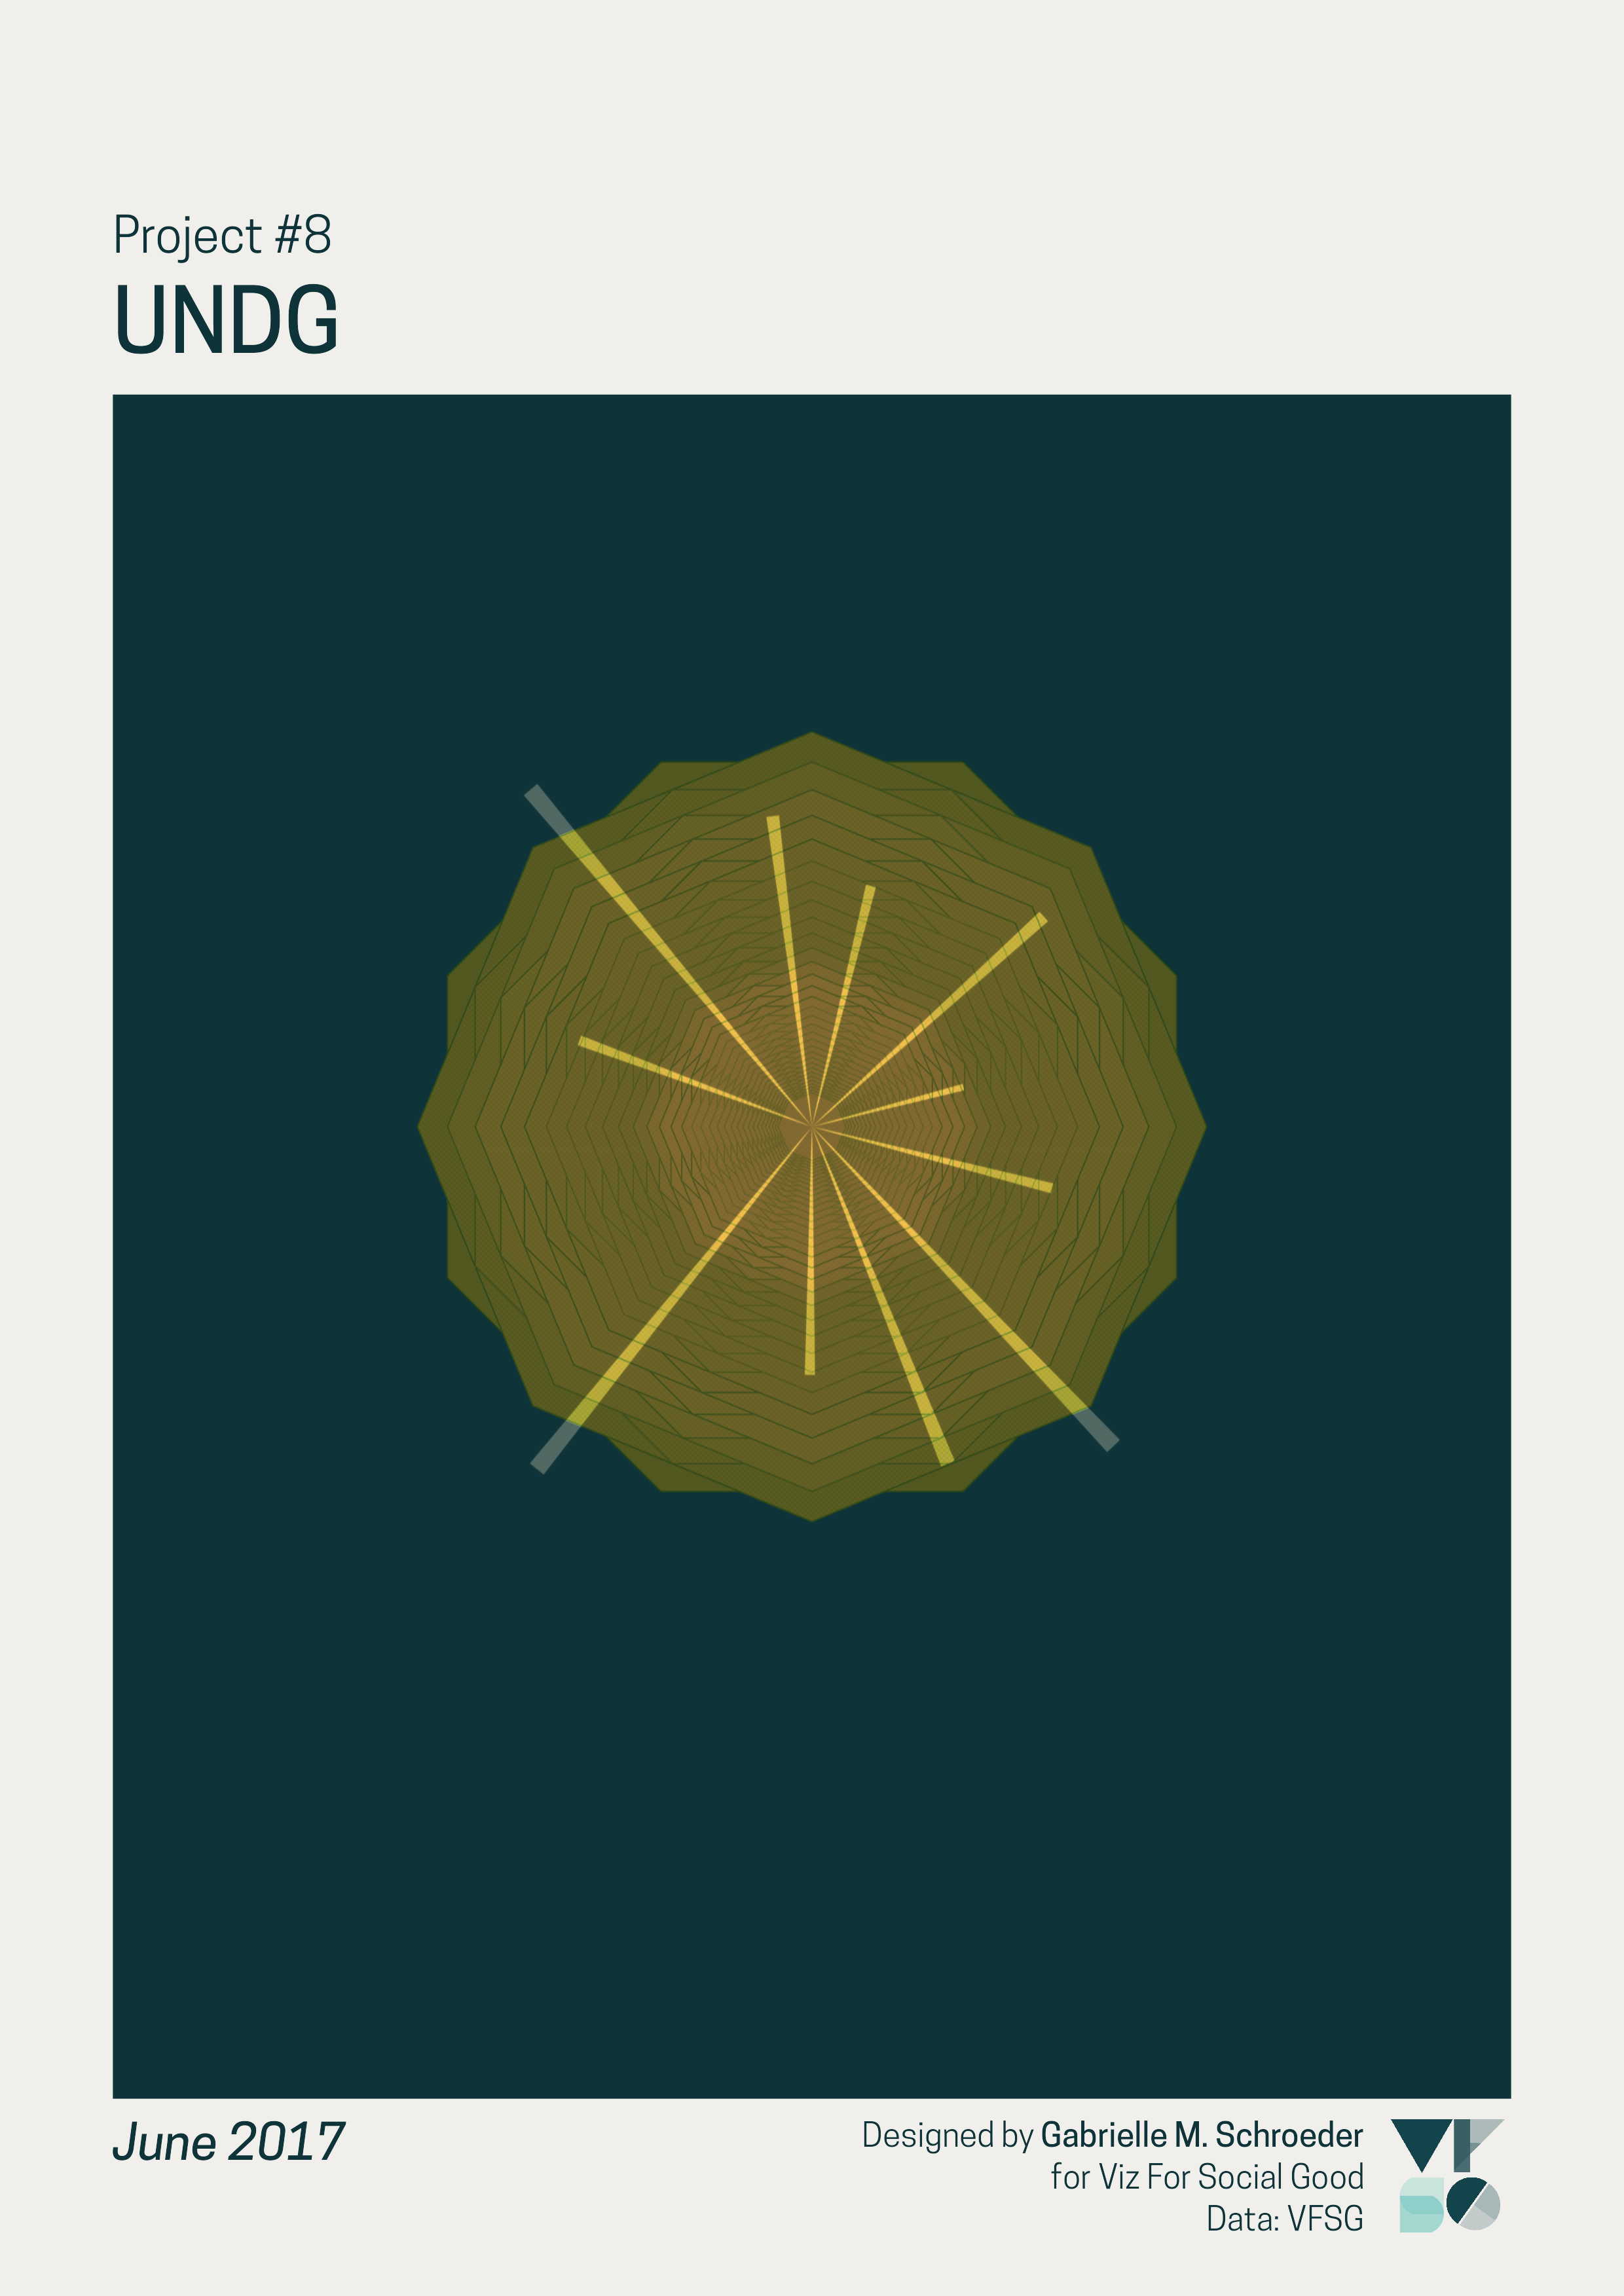
Gabrielle Schroeder data art visualizing each VFSG project


Data
Tools
You can use any tool or software you want: Tableau, PowerBi, R, Python, legos, pen and paper!
Include VFSG logo to your dashboards
In order to promote VSFG and protect your work, can we please ask you to include the VFSG logo on your dashboards (eg bottom footer section is fine). LInks to logos: https://drive.google.com/drive/folders/1PAASrdzYzQr47Rlp0yLhR4yuE4FtwJE-?usp=sharing
Support
Use Slack to ask questions #02_project_discussion